Notice
This guide is for the original release of AQtive Guard. For the current AQG SaaS platform, go to the AQtive Guard User Guide.
Dashboard↑
The AQtive Guard Dashboard provides an up-to-date visualization of the cryptographic inventory and health across all projects. You can use the dashboard in two primary ways:
- Visualization - View, assess, and analyze cryptographic data.
- Navigation - Dive deeper into specific projects, identify issues, explore instances, and review details about cryptographic inventory.
Tip
The Dashboard is the default view when you open AQtive Guard. Select Dashboard from the main menu to return from other views.
Dashboard tour↑
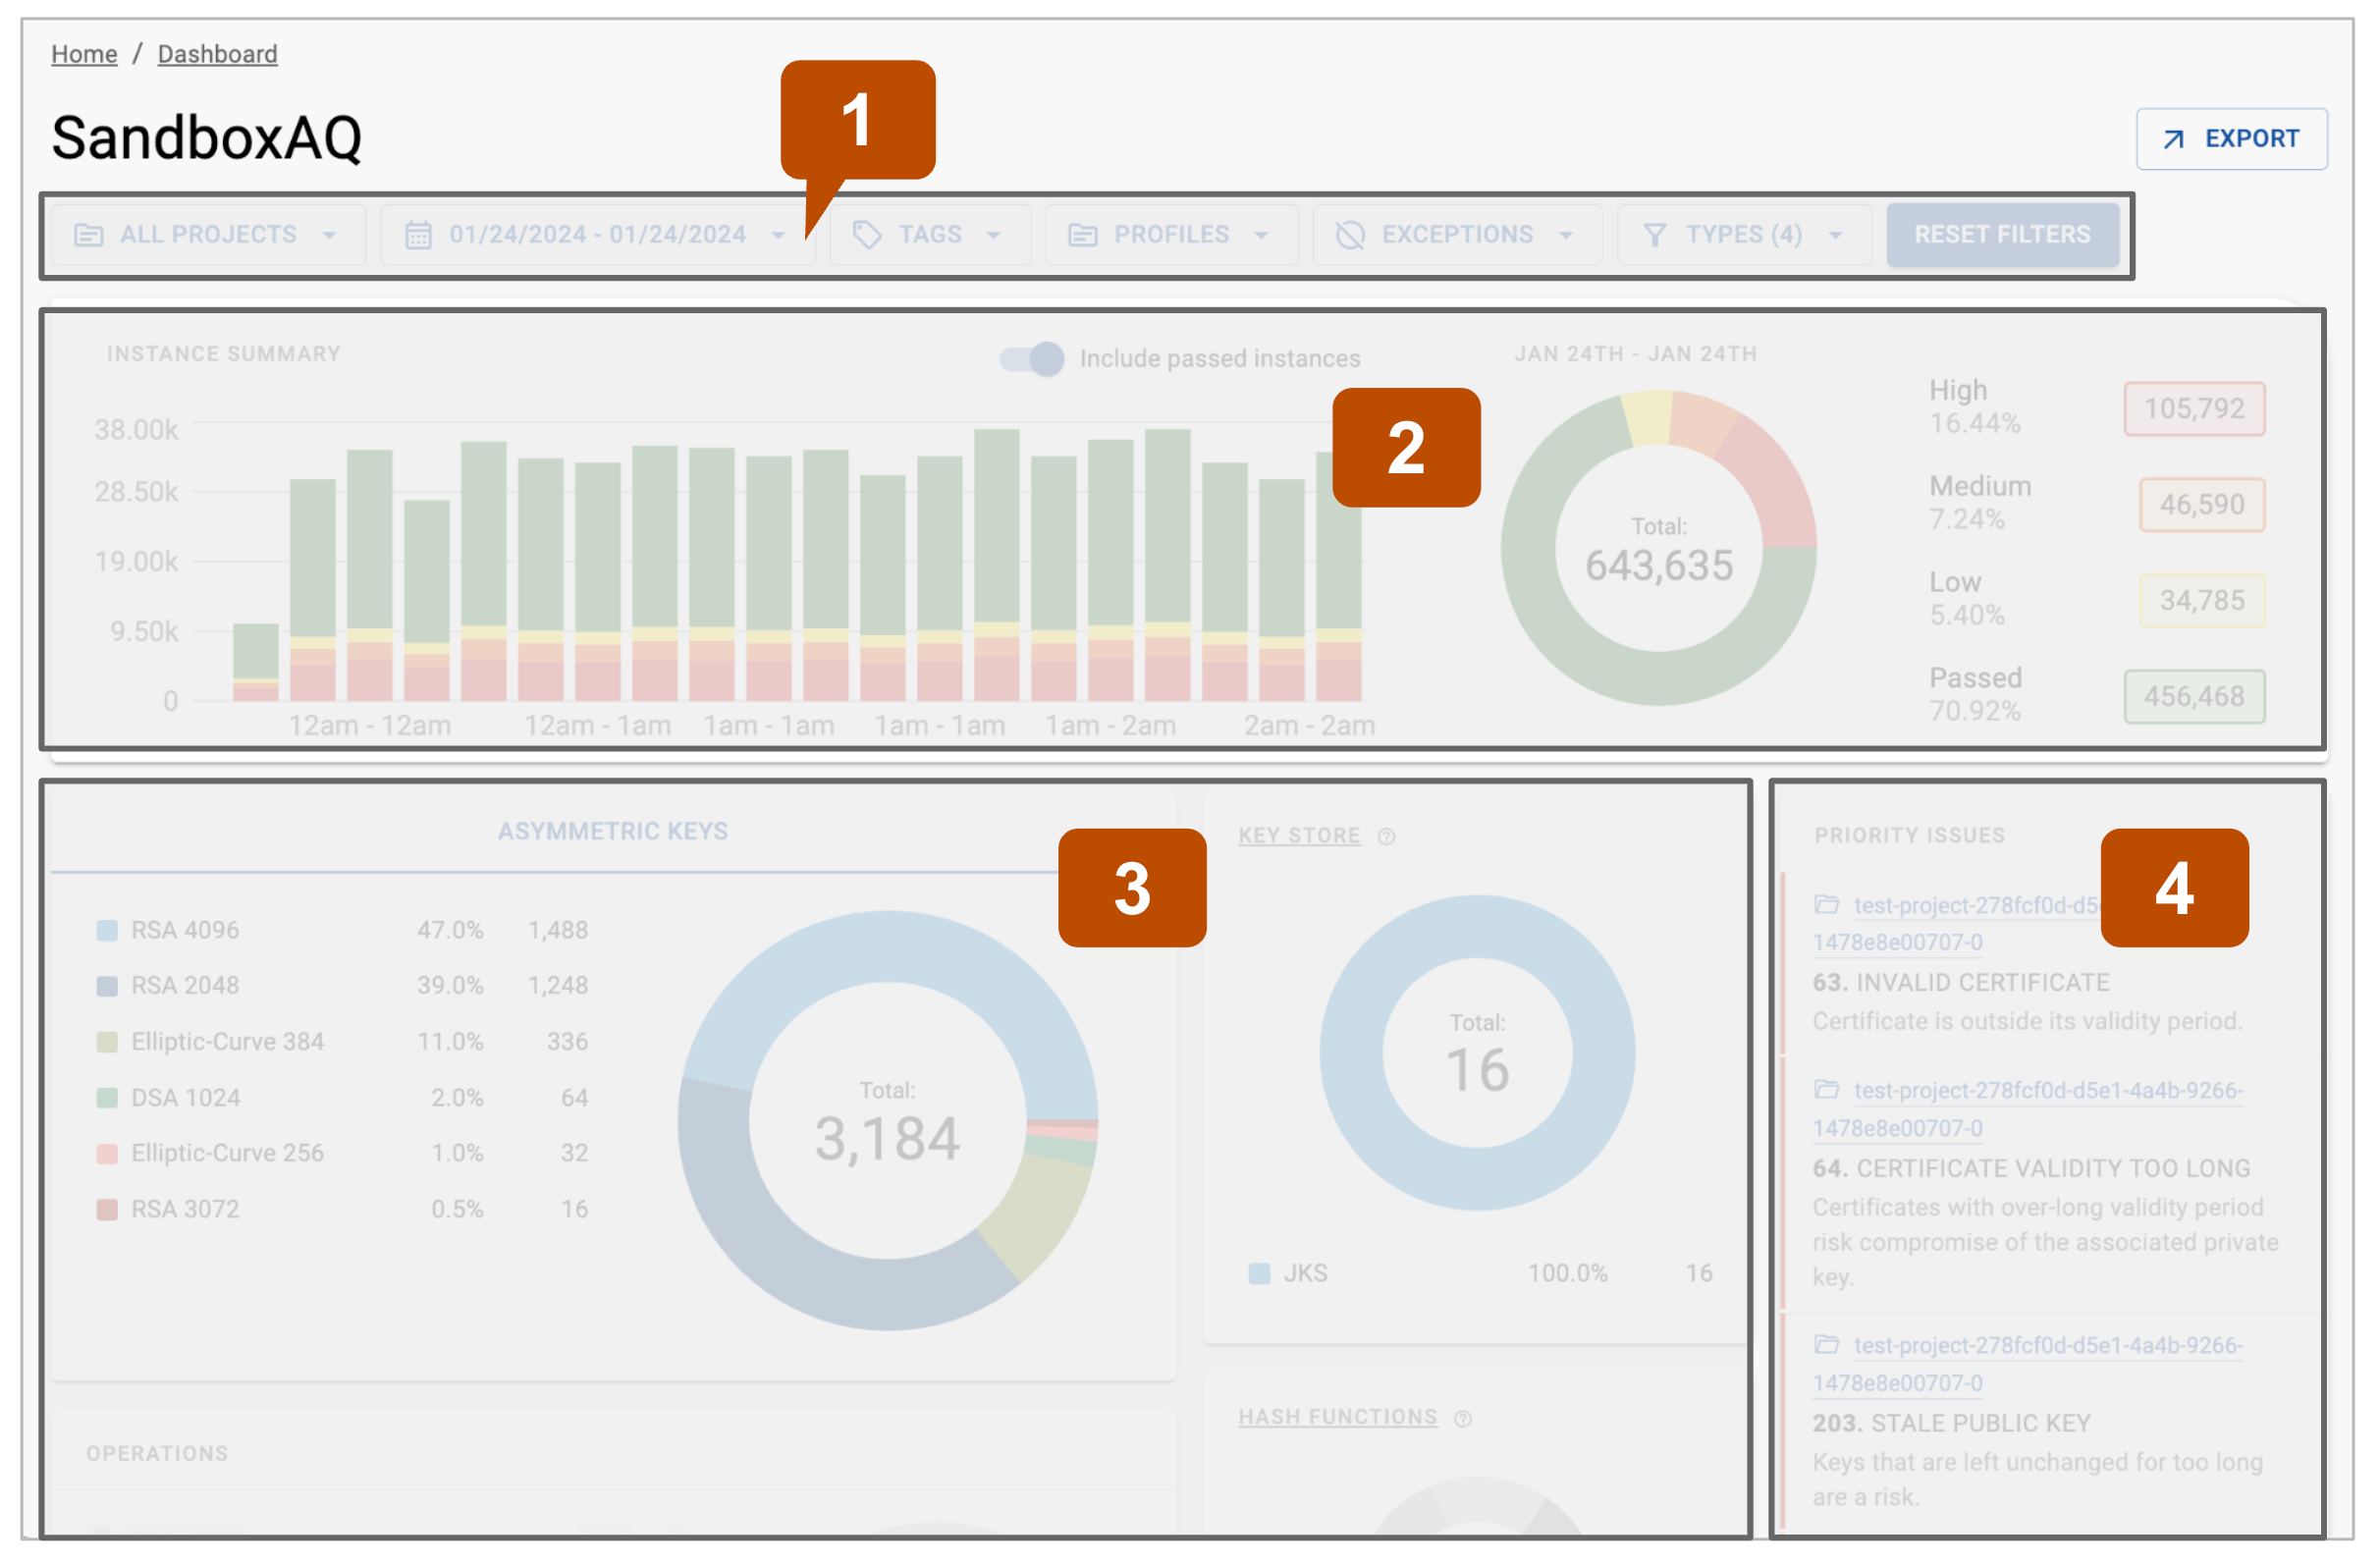
The dashboard is organized into four interactive zones to help you bring cryptographic data into focus:
- Filters (1) - Refine data granularity and identify trends.
- Instance summary (2) - Zoom into instance data for the selected time period.
- Inventory (3) - Assess the health of your cryptographic inventory.
- Priority issues (4) - Identify and explore out-of-policy rules in depth.
The following sections provide a detailed exploration of each zone.
Filters↑
Use dashboard filters to customize the displayed data. When you apply filters, the dashboard dynamically updates to show corresponding issues, instances, and inventory.

| Filter | Selection | Default |
|---|---|---|
| Projects | One or more projects | All projects |
| Time | Time period to report | Past 7 days |
| Tags | One or more custom tags | All tags |
| Profiles | One or more project profiles | All profiles |
| Exceptions | Include exceptions | Ignore exceptions |
| Types | Type of analysis (applications, filesystems, network) | All types |
Use↑
To apply a filter:
- Expand the filter dropdown.
- Use the checkboxes to select one or more attributes. You may need to use the dynamic search to narrow the list.
- Select Apply to update the dashboard based on your selections.
- To restore a filter to its default settings, select Reset at the bottom of the filter dropdown.
- Select Reset Filters to return all settings to their original state.
Tip
The filter dropdown labels update to indicate the date period and number of attributes selected.
Instance summary↑
The instance summary is a powerful tool for discovering trends in the cryptographic health of your organization over time. Instance data updates based on the date period and filter attributes applied.
Note
The default time filter is the past 7 days. An empty instance summary means that no new analyses have been run during that period. Selecting one of the presets in the time filter is an easy way to quickly populate the view.
Use↑
Select a time range in the time filter (1) to populate the trends graph.
Hover over a bar (2) to display a summary of instance details during that specific time range. You can also double-click to zoom into that data.
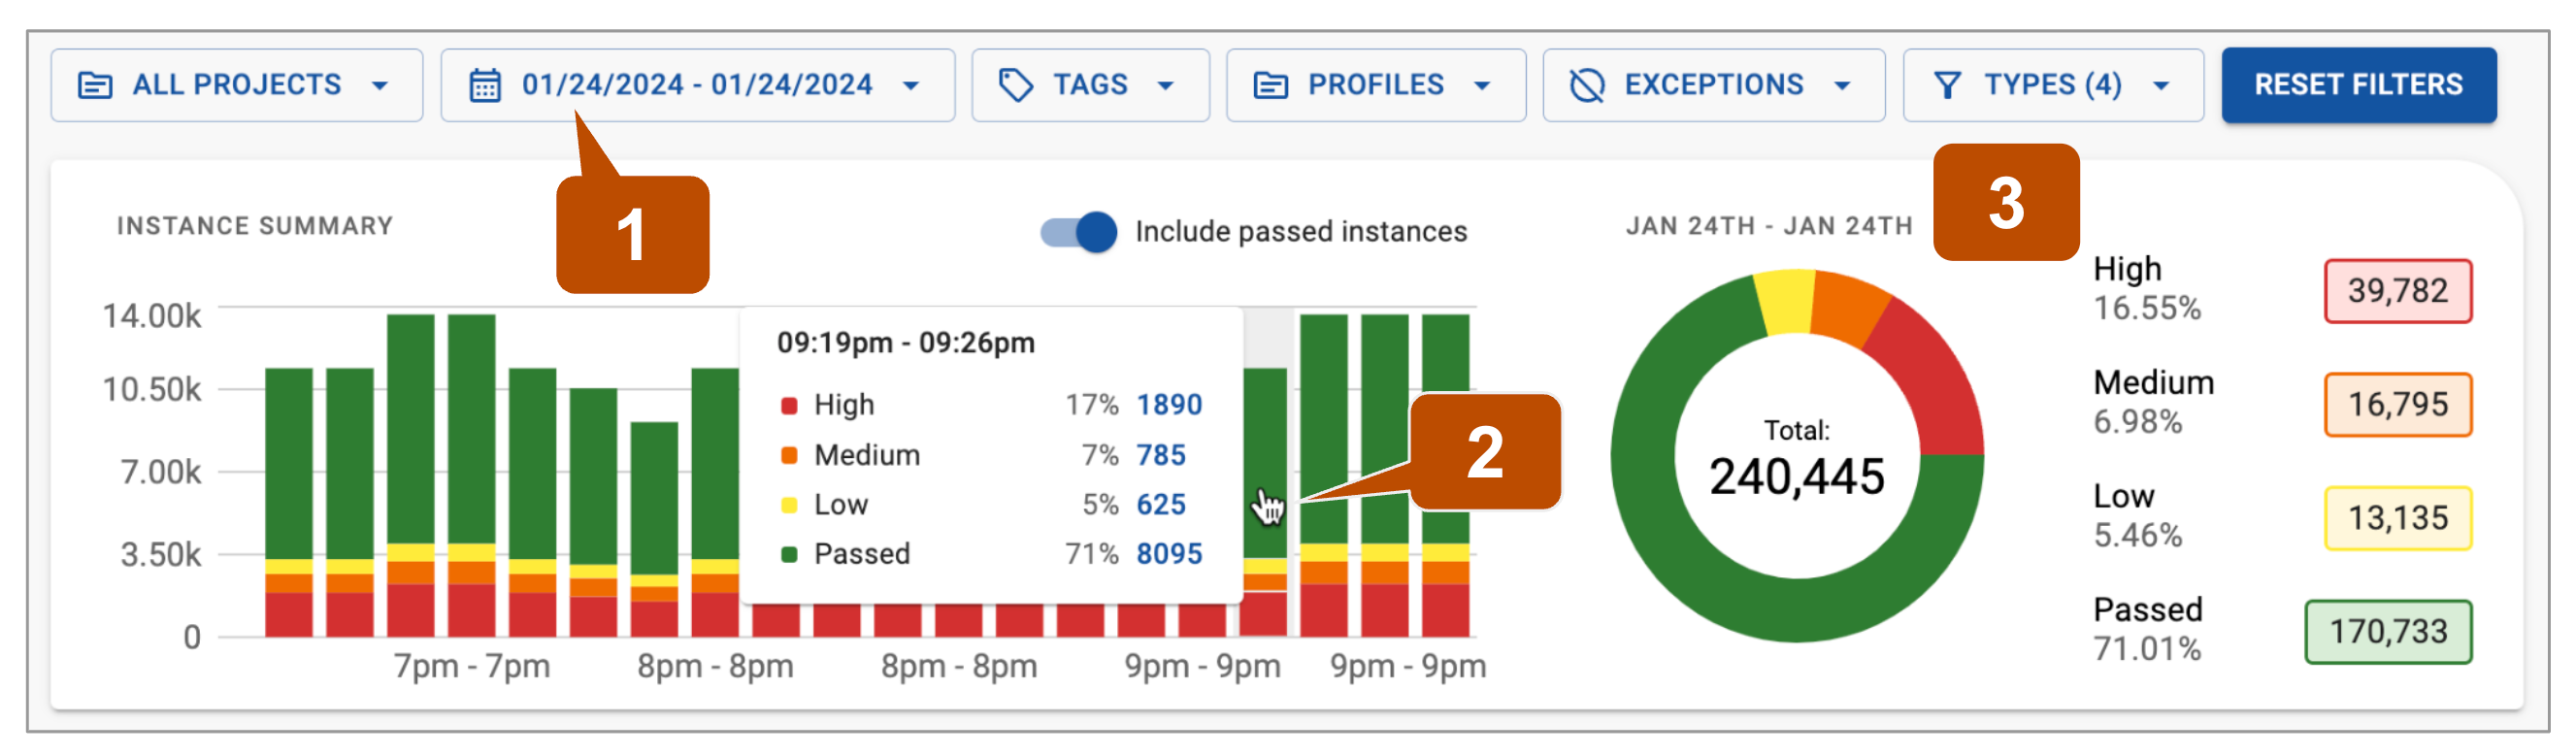
The chart and data on the right side of the panel (3) are updated based on the applied filters. This section displays the:
- Total number of Instances.
- Percentages and counts of instances that are in-policy and out-of-policy.
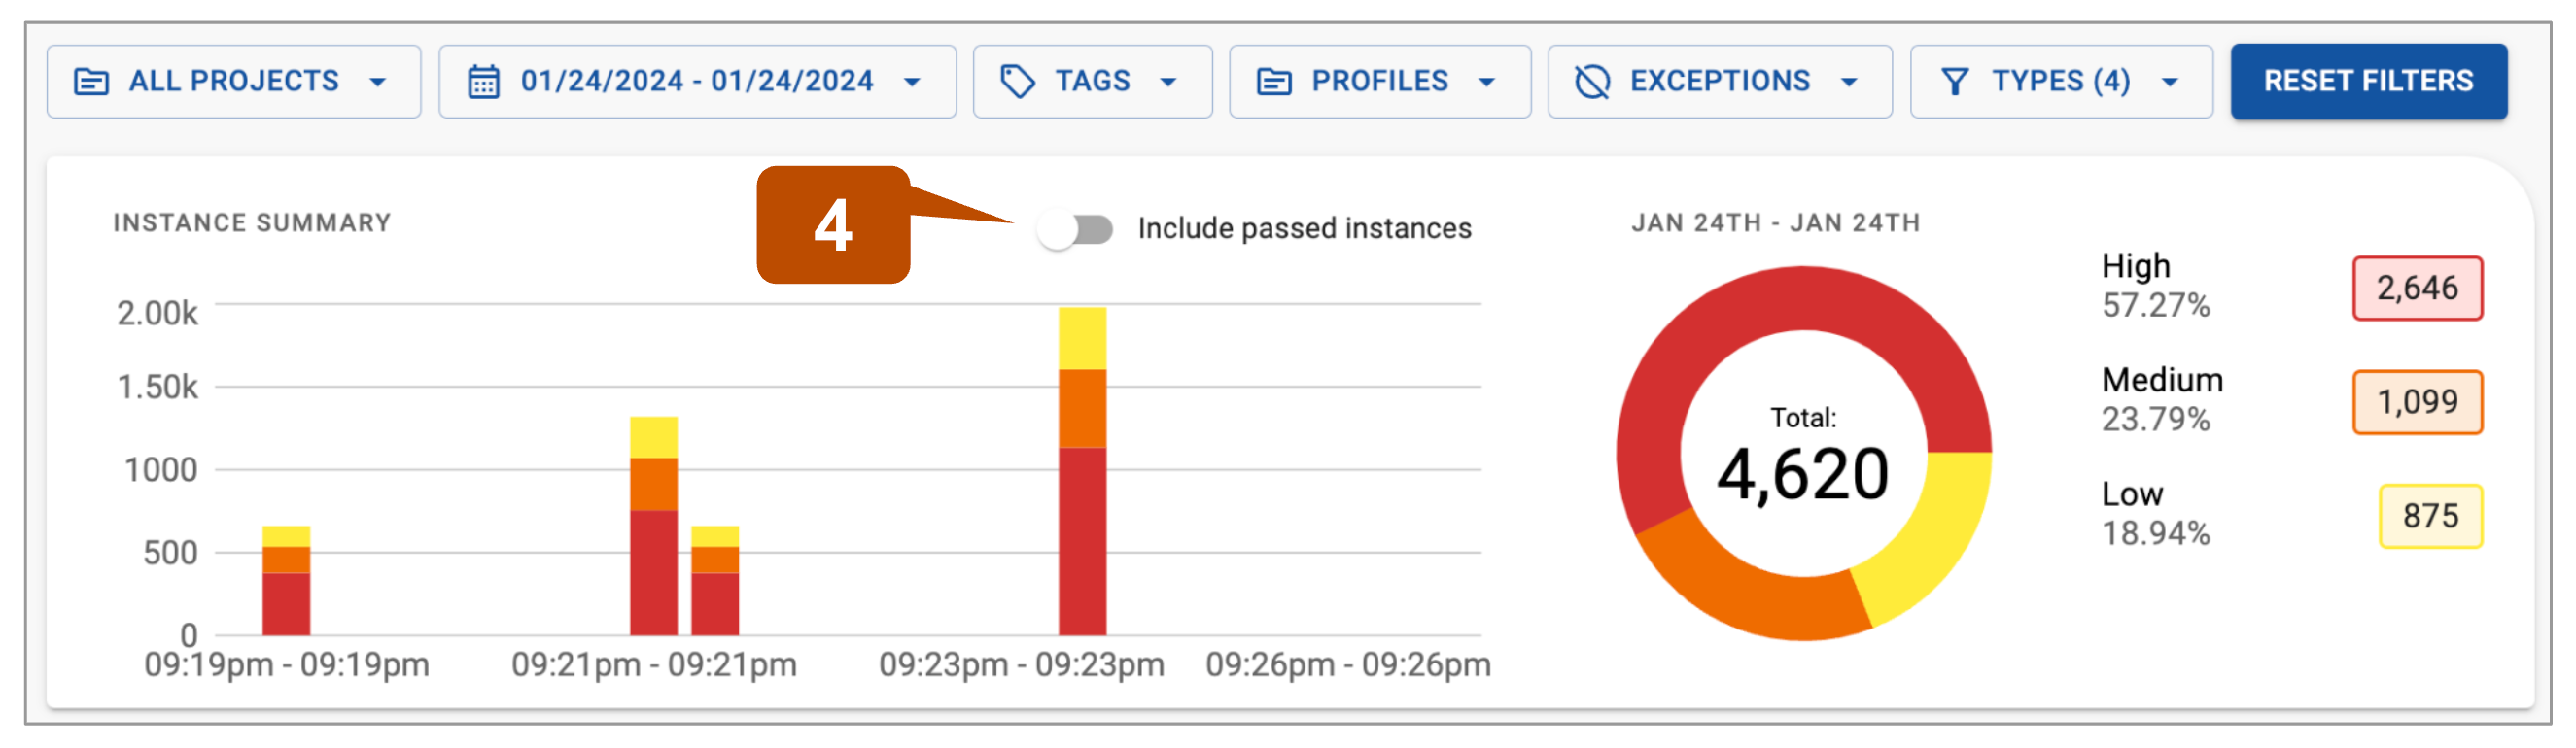
You can deactivate the Include passed instances toggle (4) to show only out-of-policy instances.
Inventory↑
The dashboard inventory charts dynamically update according to the selected filters, providing detailed insights into the aggregated cryptographic inventory. This includes:
- symmetric and asymmetric keys
- symmetric and asymmetric algorithms
- MAC
- key stores
- hash functions and operations
Tip
Hover over a legend to highlight the corresponding section of a chart and vice versa.
Priority issues↑
Priority Issues display the rules that need attention across all projects. You can dive deeper in two ways:
- Select the project name link at the top of the issue to view the associated overview and reports.
- Select the issue cell to view instances and learn more about how to remediate them.
Export↑
Select Export at the top right of the screen to generate an Inventory and issue overview for the current dashboard view. You may Print (default PDF) or Export (CSV) the overview.